library(cluster)
p <- pam(iris, 3)
p
## Medoids:
##       ID Sepal.Length Sepal.Width Petal.Length Petal.Width Species
## [1,]   8          5.0         3.4          1.5         0.2       1
## [2,] 113          6.8         3.0          5.5         2.1       3
## [3,] 100          5.7         2.8          4.1         1.3       2
## Clustering vector:
##   [1] 1 1 1 1 1 1 1 1 1 1 1 1 1 1 1 1 1 1 1 1 1 1 1 1 1 1 1 1 1 1 1 1 1 1 1 1 1 1 1 1 1 1 1
##  [44] 1 1 1 1 1 1 1 2 3 2 3 3 3 3 3 3 3 3 3 3 3 3 3 3 3 3 3 3 3 3 3 3 3 3 2 3 3 3 3 3 3 3 3
##  [87] 3 3 3 3 3 3 3 3 3 3 3 3 3 3 2 2 2 2 2 2 3 2 2 2 2 2 2 2 2 2 2 2 2 2 2 2 2 2 2 2 2 2 2
## [130] 2 2 2 2 2 2 2 2 2 2 2 2 2 2 2 2 2 2 2 2 2
## Objective function:
##     build      swap
## 0.6940644 0.6840694
##
## Available components:
##  [1] "medoids"    "id.med"     "clustering" "objective"  "isolation"  "clusinfo"
##  [7] "silinfo"    "diss"       "call"       "data"
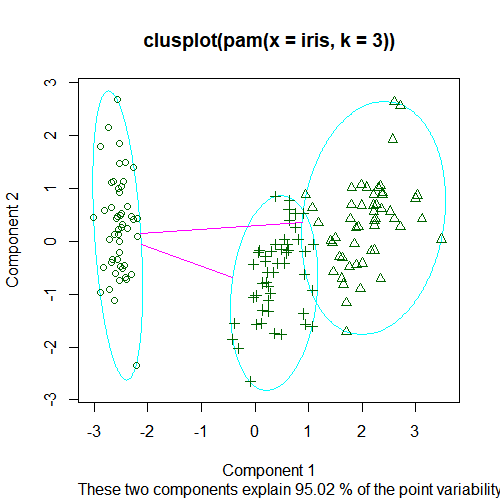
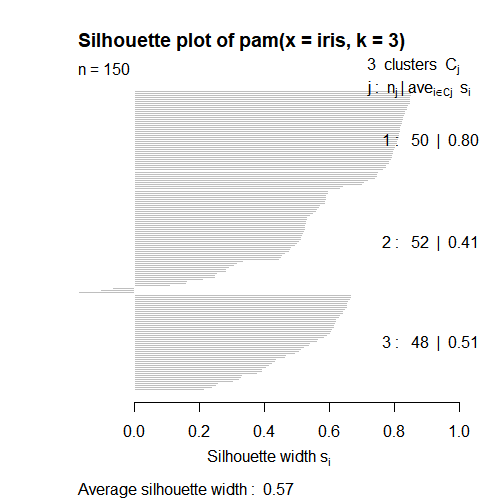
plot(p)
## Hit <Return> to see next plot:
## Hit <Return> to see next plot:

