
개요
- gnuplot
- 그누플롯
- 2차원이나 3차원 함수나 자료를 그래프로 그려 주는 명령행 응용 소프트웨어
- 1986년에 처음 개발된 프리웨어
- 현재는 리눅스, 유닉스, 윈도 맥 OS 등 다양한 운영 체제에서 실행할 수 있는 버전이 개발되어 있음
- 성능이 뛰어나기 때문에 학계 등에서 널리 쓰임
- 사용법을 해설한 웹페이지도 많음
- GNU 옥타브의 프론트 엔진으로도 쓰이고 있음

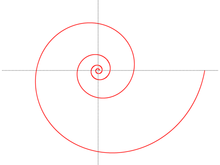
예제
# Output to png file:
set terminal png small color
set output "logarithmic_spiral.png"

# Same scale for both axes, half-size output:
set size ratio -1 0.5, 0.5

# More sample points to produce smoother picture:
set samples 170

# Axes in the center, no tick marks:
set zeroaxis
set noxtics
set noytics
set noborder
set polar

# set title "Logarithmic spiral (pitch 10 degrees)"

plot [-4*pi:4*pi] [-8:10] [-8:6] 1.19**t notitle
애플리케이션 예시
gnuplot을 쉽게 쓸 수 있도록 하는 GUI 프론트엔드 애플리케이션들