

SVG 파일의 PNG 형식의 미리보기 크기: 800 × 343 픽셀. 다른 해상도: 320 × 137 픽셀 | 640 × 274 픽셀 | 1,024 × 439 픽셀 | 1,280 × 549 픽셀 | 2,560 × 1,097 픽셀 | 1,344 × 576 픽셀
원본 파일 (SVG 파일, 실제 크기 1,344 × 576 픽셀, 파일 크기: 13 KB)
파일 설명
| 설명 |
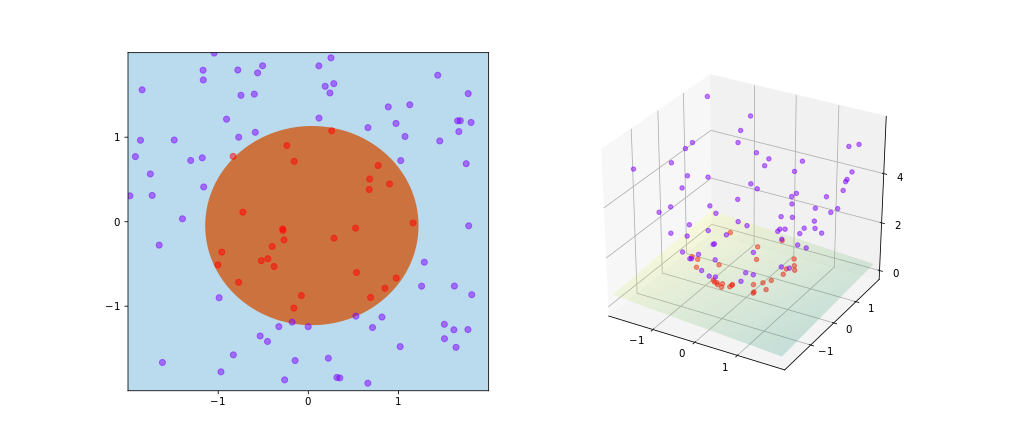
English: An illustration of kernel trick in SVM. Here the kernel is given by:
|
| 날짜 | |
| 출처 | 자작 |
| 저자 | Shiyu Ji |


Python Source Code
import numpy as np
import matplotlib
matplotlib.use('svg')
import matplotlib.pyplot as plt
from sklearn import svm
from matplotlib import cm

# Prepare the training set.
# Suppose there is a circle with center at (0, 0) and radius 1.2.
# All the points within the circle are labeled 1.
# All the points outside the circle are labeled 0.
nSamples = 100
spanLen = 2
X = np.zeros((nSamples, 2))
y = np.zeros((nSamples, ))

for i in range(nSamples):
  a, b = [np.random.uniform(-spanLen, spanLen) for _ in ['x', 'y']]
  X[i][0], X[i][1] = a, b
  y[i] = 1 if a*a + b*b < 1.2*1.2 else 0

# Custom kernel,
def my_kernel(A, B):
  gram = np.zeros((A.shape[0], B.shape[0]))
  for i in range(A.shape[0]):
    for j in range(B.shape[0]):
      assert A.shape[1] == B.shape[1]
      L2A, L2B = 0.0, 0.0
      for k in range(A.shape[1]):
        gram[i, j] += A[i, k] * B[j, k]
        L2A += A[i, k] * A[i, k]
        L2B += B[j, k] * B[j, k]
      gram[i, j] += L2A * L2B
  return gram

# SVM train.
clf = svm.SVC(kernel = my_kernel)
clf.fit(X, y)
coef = clf.dual_coef_[0]
sup = clf.support_
b = clf.intercept_
x_min, x_max = -spanLen, spanLen
y_min, y_max = -spanLen, spanLen
xx, yy = np.meshgrid(np.arange(x_min, x_max, .02), np.arange(y_min, y_max, .02))
Z = clf.predict(np.c_[xx.ravel(), yy.ravel()])
Z = Z.reshape(xx.shape)

# Plot the 2D layout.
fig = plt.figure(figsize = (6, 14))
plt1 = plt.subplot(121)
plt1.set_xlim([-spanLen, spanLen])
plt1.set_ylim([-spanLen, spanLen])
plt1.set_xticks([-1, 0, 1])
plt1.set_yticks([-1, 0, 1])
plt1.pcolormesh(xx, yy, Z, cmap=cm.Paired)
y_unique = np.unique(y)
colors = cm.rainbow(np.linspace(0.0, 1.0, y_unique.size))
for this_y, color in zip(y_unique, colors):
  this_Xx = [X[i][0] for i in range(len(X)) if y[i] == this_y]
  this_Xy = [X[i][1] for i in range(len(X)) if y[i] == this_y]
  plt1.scatter(this_Xx, this_Xy, c=color, alpha=0.5)

# Process the training data into 3D by applying the kernel mapping:
# phi(x, y) = (x, y, x*x + y*y).
X3d = np.ndarray((X.shape[0], 3))
for i in range(X.shape[0]):
    a, b = X[i][0], X[i][1]
    X3d[i, 0], X3d[i, 1], X3d[i, 2] = [a, b, a*a + b*b]

# Plot the 3D layout after applying the kernel mapping.
from mpl_toolkits.mplot3d import Axes3D
plt2 = plt.subplot(122, projection="3d")
plt2.set_xlim([-spanLen, spanLen])
plt2.set_ylim([-spanLen, spanLen])
plt2.set_xticks([-1, 0, 1])
plt2.set_yticks([-1, 0, 1])
plt2.set_zticks([0, 2, 4])
for this_y, color in zip(y_unique, colors):
  this_Xx = [X3d[i, 0] for i in range(len(X3d)) if y[i] == this_y]
  this_Xy = [X3d[i, 1] for i in range(len(X3d)) if y[i] == this_y]
  this_Xz = [X3d[i, 2] for i in range(len(X3d)) if y[i] == this_y]
  plt2.scatter(this_Xx, this_Xy, this_Xz, c=color, alpha=0.5)

# Plot the 3D boundary.
def onBoundary(x, y, z, X3d, coef, sup, b):
  err = 0.0
  n = len(coef)
  for i in range(n):
    err += coef[i] * (x*X3d[sup[i], 0] + y*X3d[sup[i], 1] + z*X3d[sup[i], 2])
  err += b
  if abs(err) < .1:
    return True
  return False

Xr = np.arange(x_min, x_max, .02)
Yr = np.arange(y_min, y_max, .02)
Z = np.zeros(Z.shape)
for i in range(Xr.shape[0]):
  x = Xr[i]
  for j in range(Yr.shape[0]):
    y = Yr[j]
    for z in np.arange(0, 2, .02):
      if onBoundary(x, y, z, X3d, coef, sup, b):
        Z[i, j] = z
        break
plt2.plot_surface(xx, yy, Z, cmap='summer', alpha=0.2)

plt.savefig("kernel_trick_idea.svg", format = "svg")
라이선스
나는 아래 작품의 저작권자로서, 이 저작물을 다음과 같은 라이선스로 배포합니다:
이 파일은 크리에이티브 커먼즈 저작자표시-동일조건변경허락 4.0 국제 라이선스로 배포됩니다.
- 이용자는 다음의 권리를 갖습니다:
- 공유 및 이용 – 저작물의 복제, 배포, 전시, 공연 및 공중송신
- 재창작 – 저작물의 개작, 수정, 2차적저작물 창작
- 다음과 같은 조건을 따라야 합니다:
- 저작자표시 – 적절한 저작자 표시를 제공하고, 라이선스에 대한 링크를 제공하고, 변경사항이 있는지를 표시해야 합니다. 당신은 합리적인 방식으로 표시할 수 있지만, 어떤 방식으로든 사용권 허가자가 당신 또는 당신의 사용을 지지하는 방식으로 표시할 수 없습니다.
- 동일조건변경허락 – 만약 당신이 이 저작물을 리믹스 또는 변형하거나 이 저작물을 기반으로 제작하는 경우, 당신은 당신의 기여물을 원저작물과 동일하거나 호환 가능한 라이선스에 따라 배포하여야 합니다.
파일 역사
날짜/시간 링크를 클릭하면 해당 시간의 파일을 볼 수 있습니다.
| 날짜/시간 | 크기 | 사용자 | 설명 | |
|---|---|---|---|---|
| 현재 | 2020년 7월 17일 (금) 23:41 | 1,344 × 576 (13 KB) | SemperVinco | Optimized svg code |
이 파일을 사용하는 문서
다음 문서 1개가 이 파일을 사용하고 있습니다: